live project Owner portal dashboard
Guesty is a property management platform used to manage more than 500,000 properties worldwide. I led the design of the Owner Portal dashboard, a white-label web and mobile experience where property owners track performance. As Guesty moved into the enterprise market, the portal became an important part of the sales process. Large property managers needed a scalable experience they could trust for thousands of owners.
The goal was to turn fragmented data into one clear overview across brands, languages, currencies, devices, and property portfolios.
Owner portal dashboard
Why this mattered
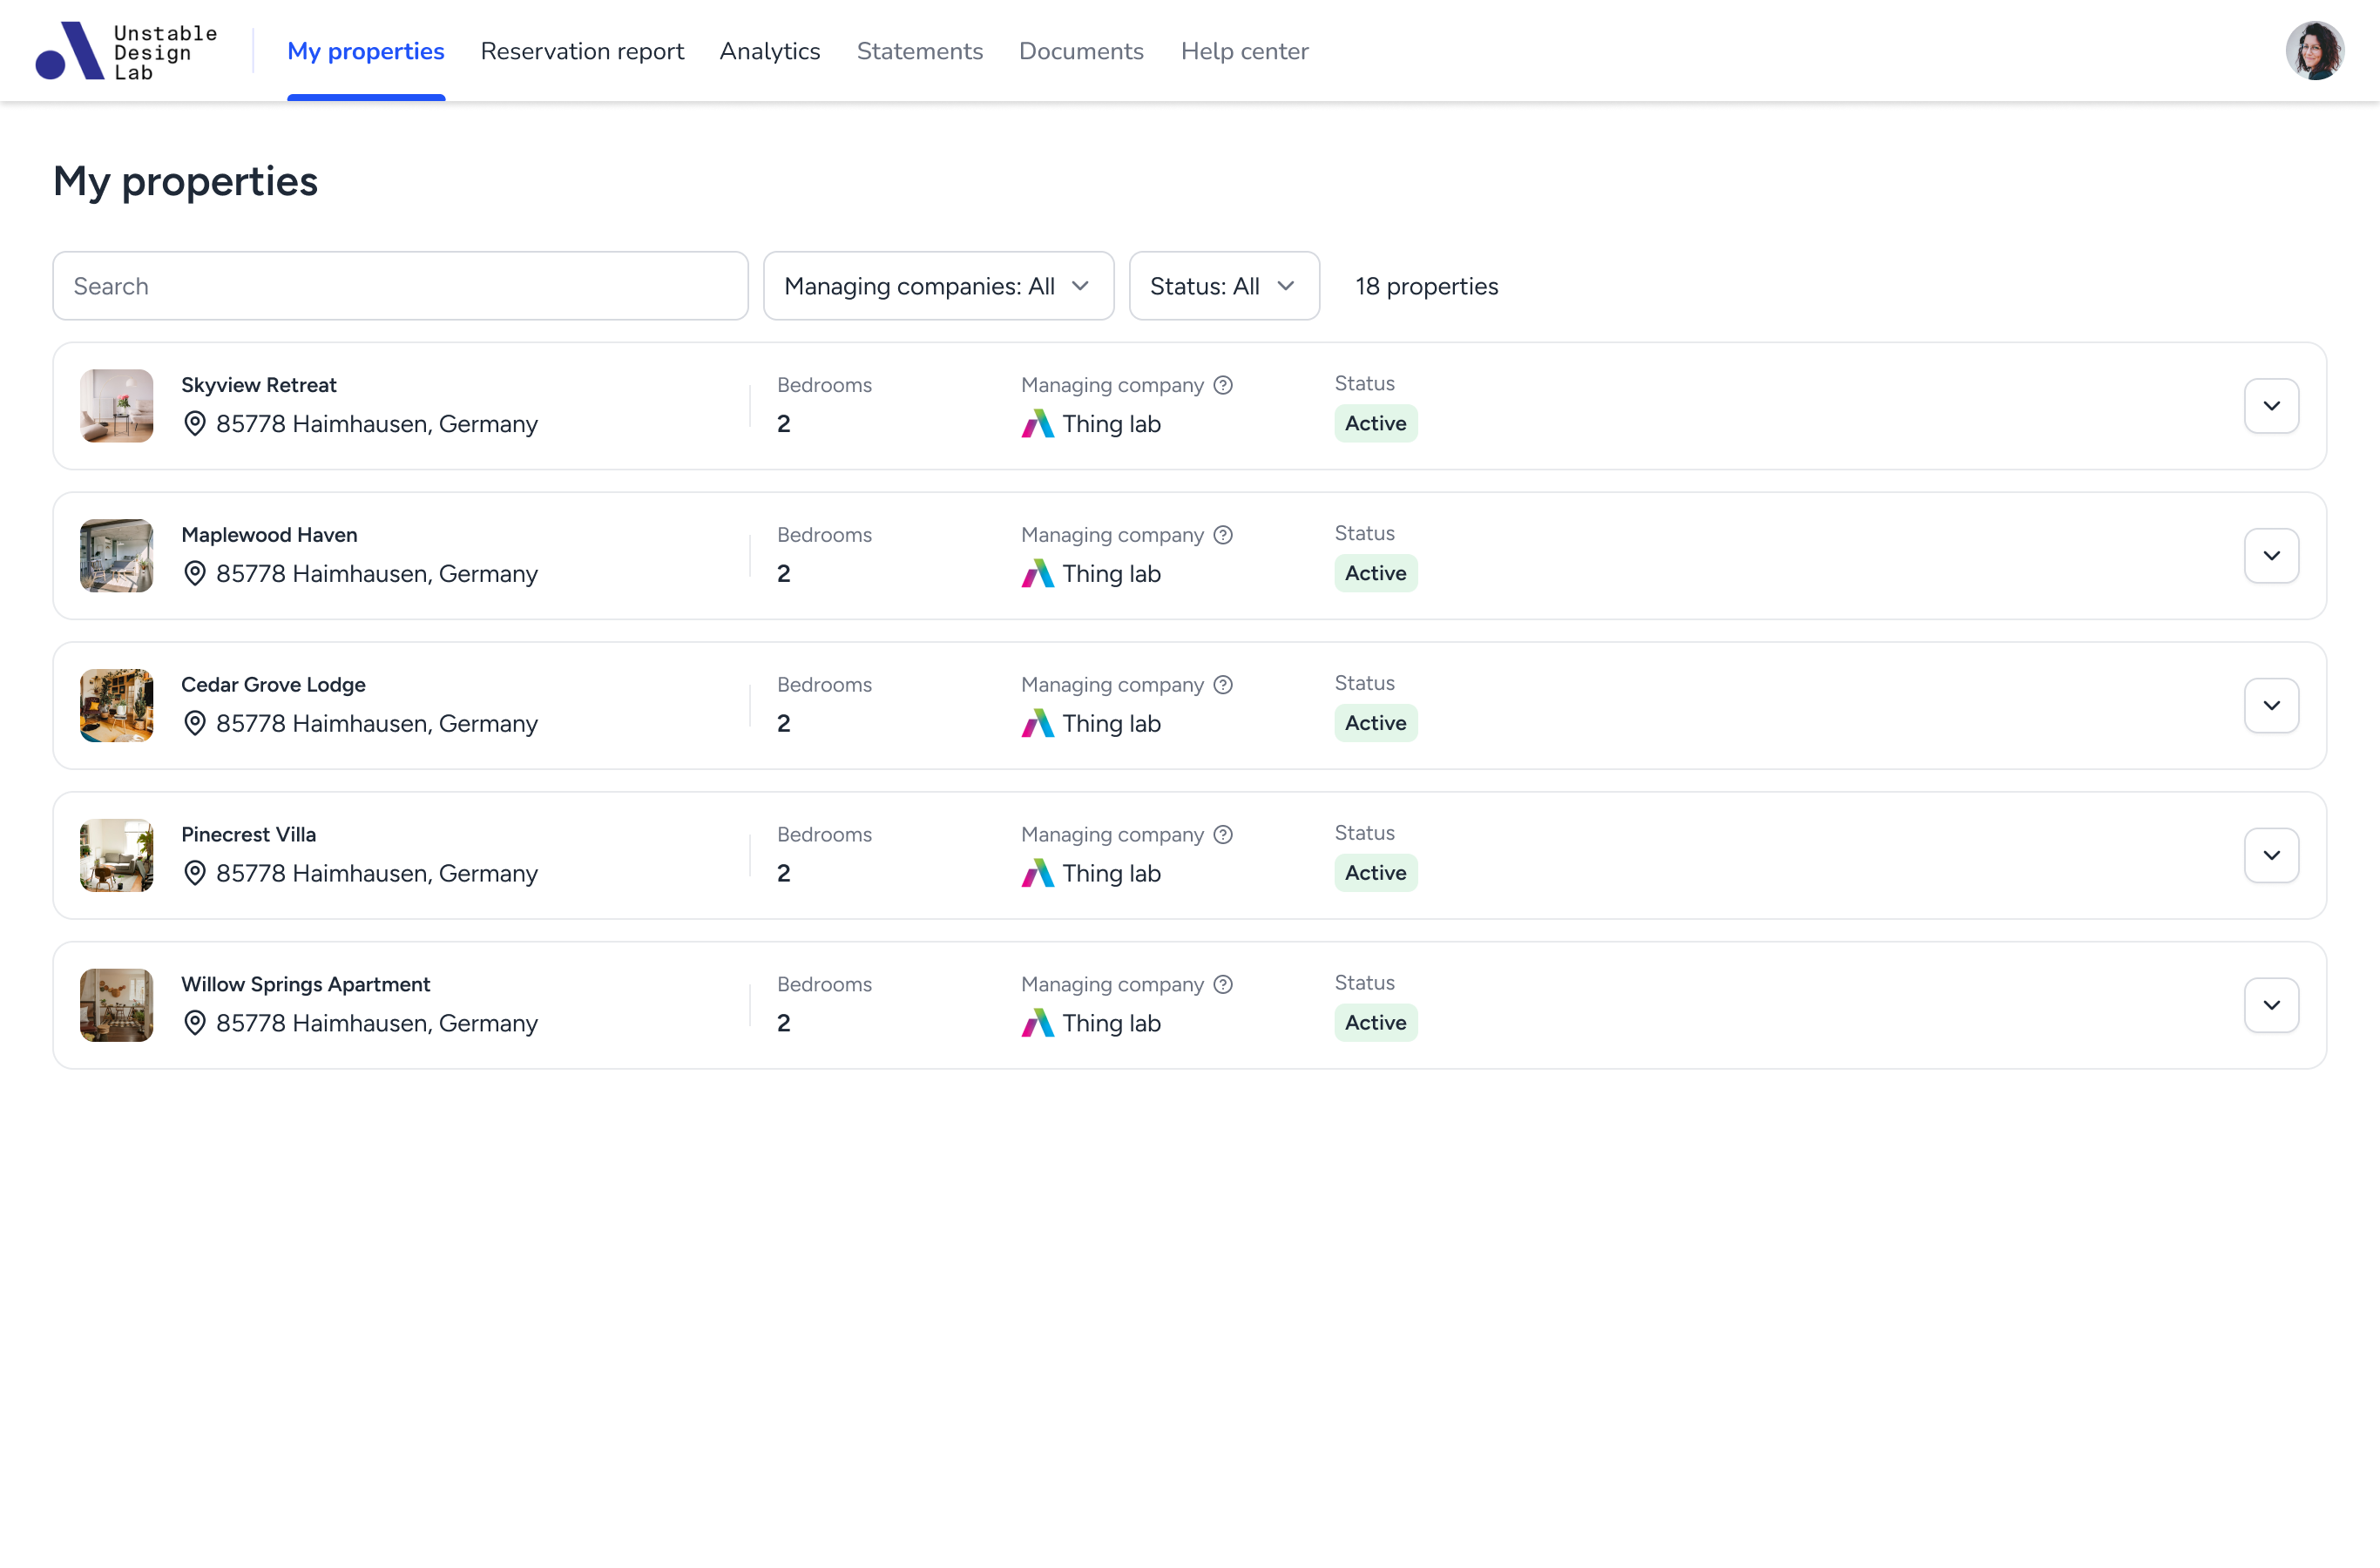
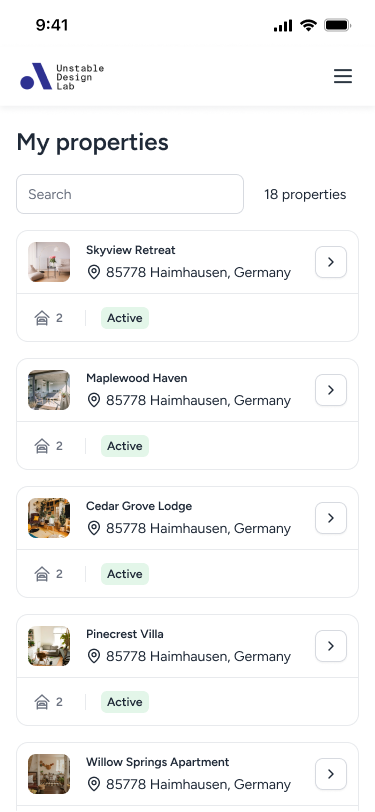
The portal did not give owners a simple performance overview. As a result, PMCs handled repeated questions, submitted feature requests, and relied on custom spreadsheets.
The challenge
Key performance data was spread across different parts of the portal, making it difficult for owners to understand the full picture. This was especially challenging on mobile and for owners managing multiple properties.
Defining the dashboard
I combined portal data, PMC requests, competitor research, and user feedback to identify the information owners used most often. This helped me prioritize revenue, occupancy, reservations, reviews, and support as the dashboard’s core content.
Jira's board overview
Design principles
Lead with essential data
Give revenue, occupancy, and reservation activity the strongest visual priority so owners can understand performance quickly.
Adapt to each screen size
Reorganize cards, charts, and actions across breakpoints instead of compressing the desktop.
Support every portfolio size
Create one system that works for owners viewing a single property or managing multiple properties.
First prototype and get user feedback
I combined portal data, PMC requests, competitor research, and user feedback to identify the information owners used most often. This helped me prioritize revenue, occupancy, reservations, reviews, and support as the dashboard’s core content.
Here is the interview with one of the Property managers

Creating the flexible layout
I translated these priorities into a modular, card-based dashboard.
Essentials
Standard
Full
Result
Through product improvements and a redesigned user experience, I helped drive a 45% increase in portal engagement and a 10.4% increase in daily owner visits.
My biggest takeaway was that users should not feel the complexity behind the product. Even though the dashboard supported many devices, portfolio sizes, and configurations, the experience still needed to feel clear and straightforward.
full desktop, tablet and mobile sizes
Interested in the full case study?
The complete case study shows how the project evolved from early research to the final product and launch
schedule a meeting
{{ rCounter }}